Prometheis & Grafana
2025-09-02
3 min read
seal
Step1: Install Core Services (Prometheus + Grafana)
This step will use Docker Compose to done it.
Create dir
First we need dirs used for persistent storage of Prometheus and Grafana data;
mkdir -p /data/prometheus /data/grafana
here don't forget to set 777 permission
Create Prometheus Config
touch a file named prometheus.yml, and vim it with codes below:
global:
    scrape_interval: 15s

scrape_configs:
    - job_name: 'prometheus'
        static_configs:
            - targets: ['localhost:9090']
Create Docker Compose File
the same
version: '3.8'
services:
  prometheus:
    image: p0v1gak9a5omuz.xuanyuan.run/prom/prometheus:latest
    container_name: prometheus
    ports:
      - "9090:9090"
    volumes:
      - /data/prometheus/prometheus.yml:/etc/prometheus/prometheus.yml:Z
      - /data/prometheus/:/prometheus/:Z
    command:
      - '--config.file=/etc/prometheus/prometheus.yml'
      - '--storage.tsdb.path=/prometheus'
      - '--web.listen-address=0.0.0.0:9090'
    restart: unless-stopped
  grafana:
    image: p0v1gak9a5omuz.xuanyuan.run/grafana/grafana:latest
    container_name: grafana
    ports:
      - "3000:3000"
    volumes:
      - /data/grafana/:/var/lib/grafana:Z
      - /data/grafana/grafana.ini:/etc/grafana/grafana.ini:Z
    environment:
      - GF_SECURITY_ADMIN_PASSWORD=admin
      - GF_SERVER_HTTP_ADDR=0.0.0.0
      - GF_AUTH_ANONYMOUS_ENABLED=true
      - GF_AUTH_ANONYMOUS_ORG_ROLE=Viewer
      - GF_AUTH_ANONYMOUS_ORG_NAME=Main Org.
    restart: unless-stopped
Here set some environments, allow "Viewer"
Start service
docker-compose -f prometheus_dockerfile.yml up -d
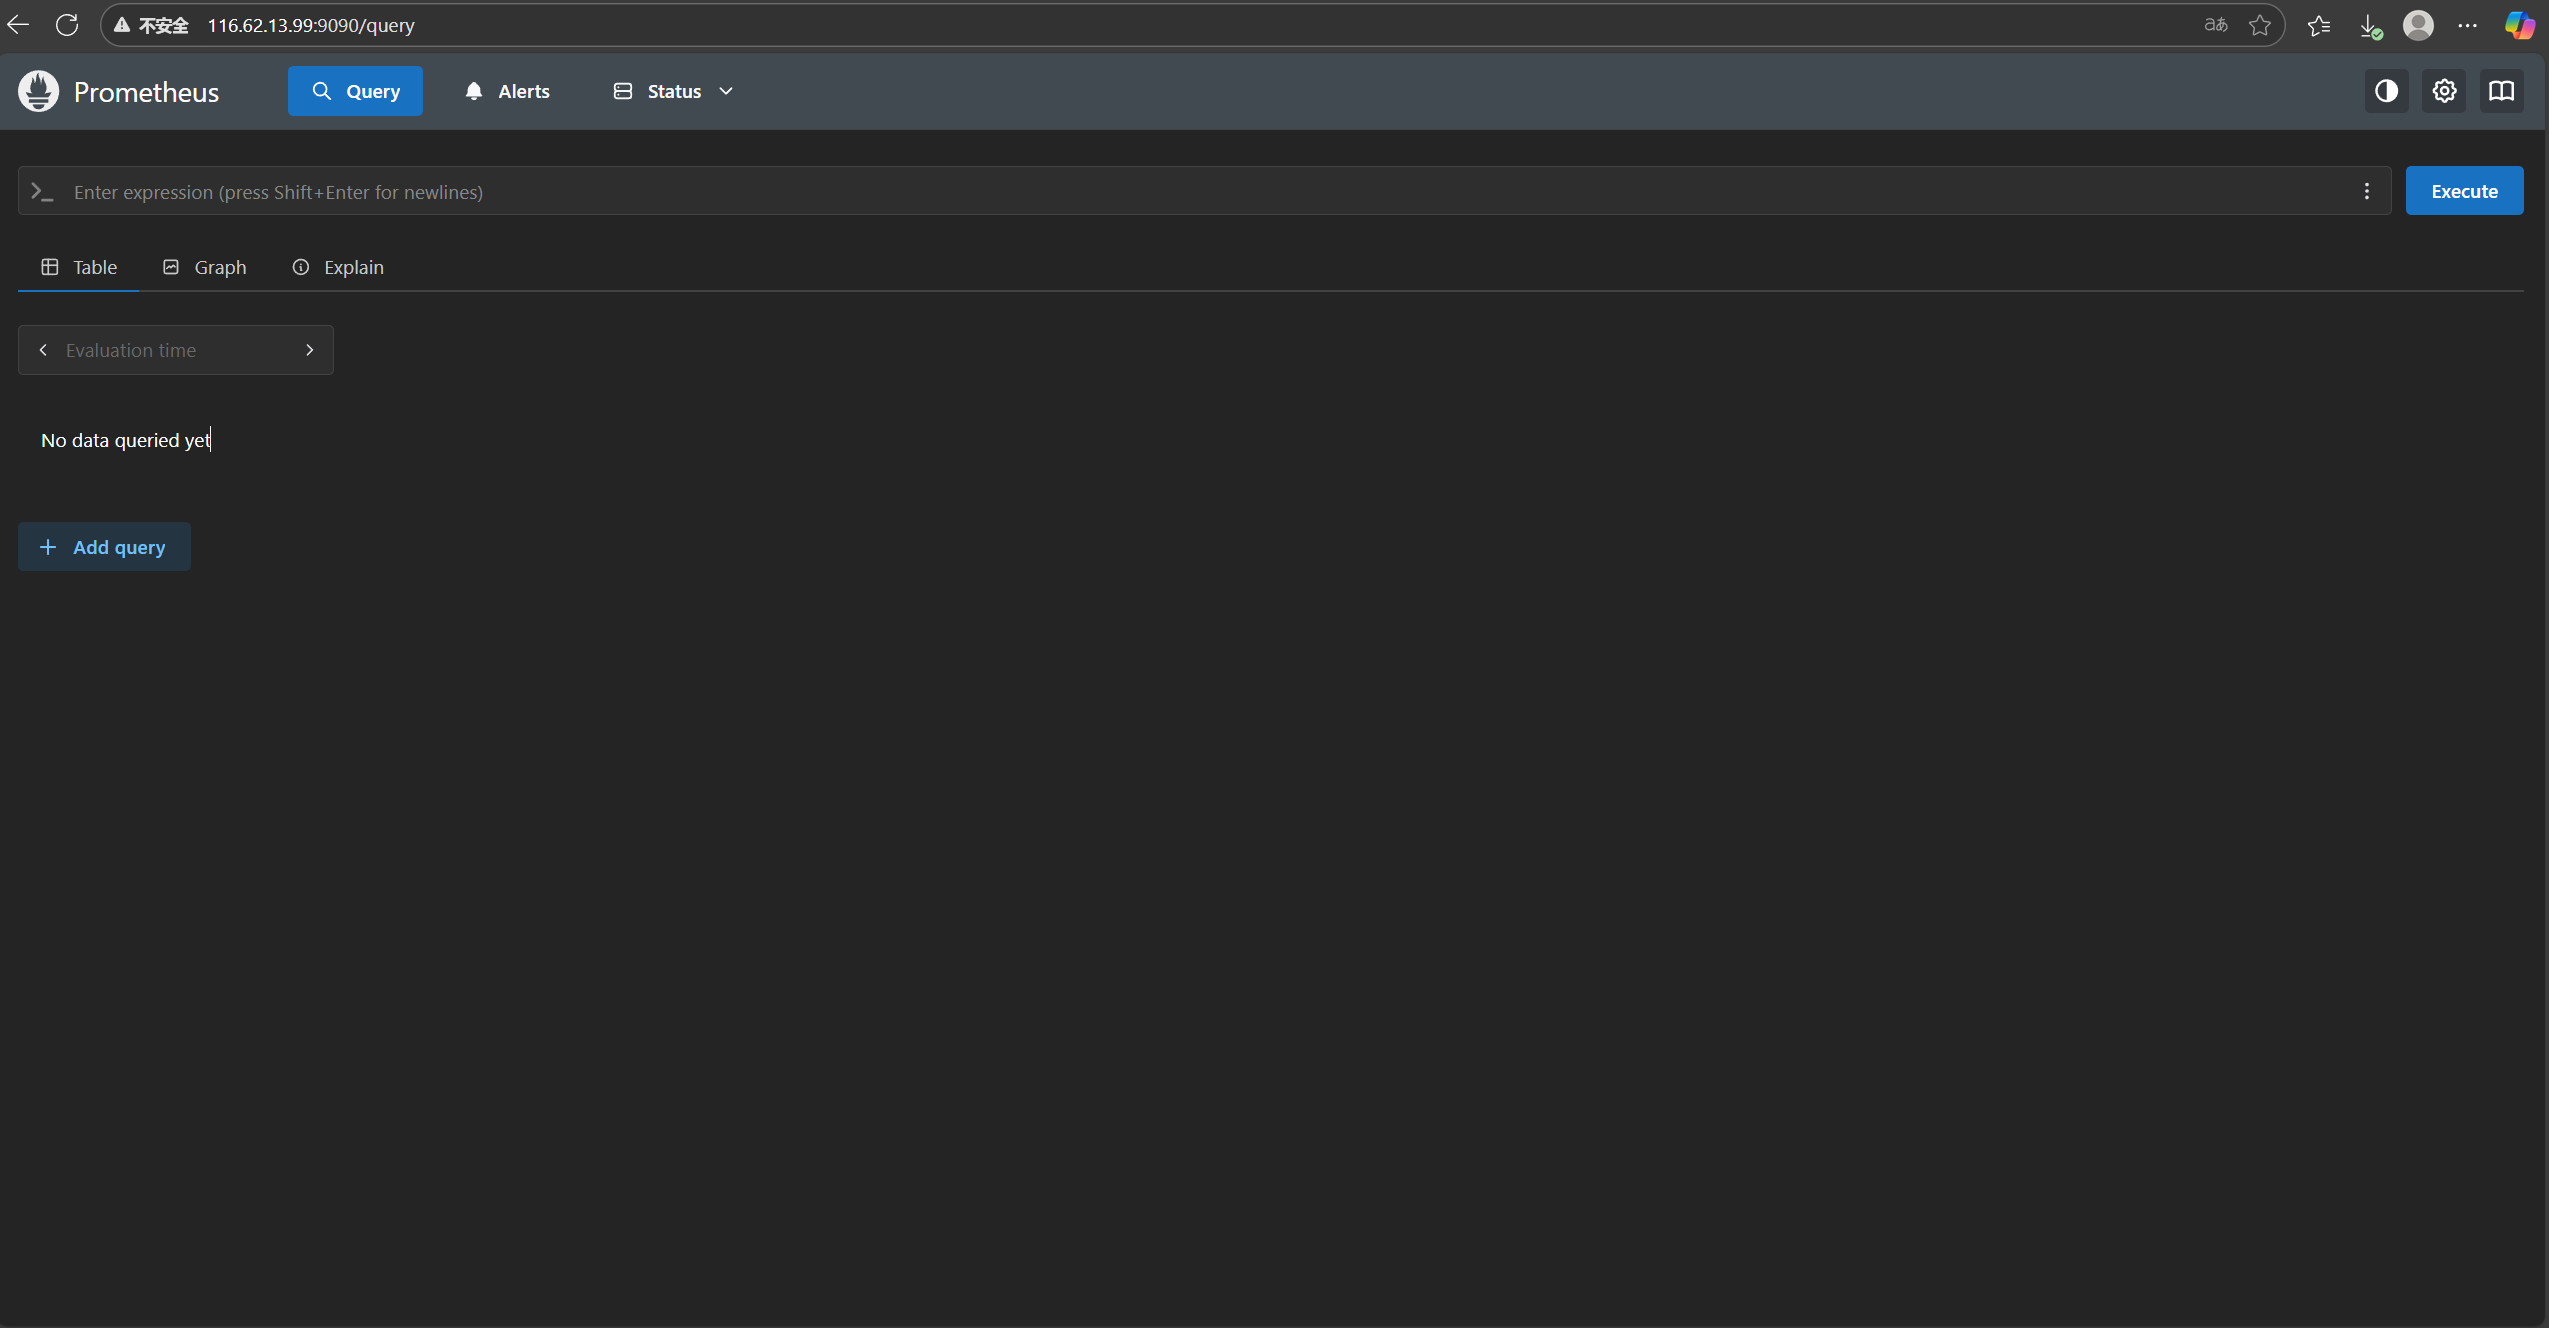
Test it
Step2: Install Node Exporter
create user
sudo useradd -rs /bin/false node_exporter
install bineary package and deploy it
tar xvfz node_exporter-*.linux-amd64.tar.gz
sudo mv node_exporter-*.linux-amd64 /opt/node_exporter
sudo chown -R node_exporter:node_exporter /opt/node_exporter
create systemd service
vim /etc/systemd/system/node_exporter.service

Enter:[i], fixed with:

    [Unit]
    Description=node_exporter
    After=network.target
    [Service]
    ExecStart=/opt/node_exporter/node_exporter         --web.listen-address=0.0.0.0:9100          --collector.systemd          --collector.systemd.unit-whitelist=(sshd|nginx).service          --collector.processes          --collector.tcpstat
    [Install]
    WantedBy=multi-user.target


Use code below to start:

    sudo systemctl daemon-reload
    sudo systemctl enable node_exporter
    sudo systemctl start node_exporter
Merge and Visualization
update Prometheus config
vim /data/prometheus/prometheus.yml

Add monitor task:

        global:
        scrape_interval: 15s

        scrape_configs:
        - job_name: 'prometheus'
            static_configs:
            - targets: ['prometheus:9090']
        - job_name: 'node_exporter'
            static_configs:
            - targets: ['192.168.1.97:9100']

docker restart prometheus
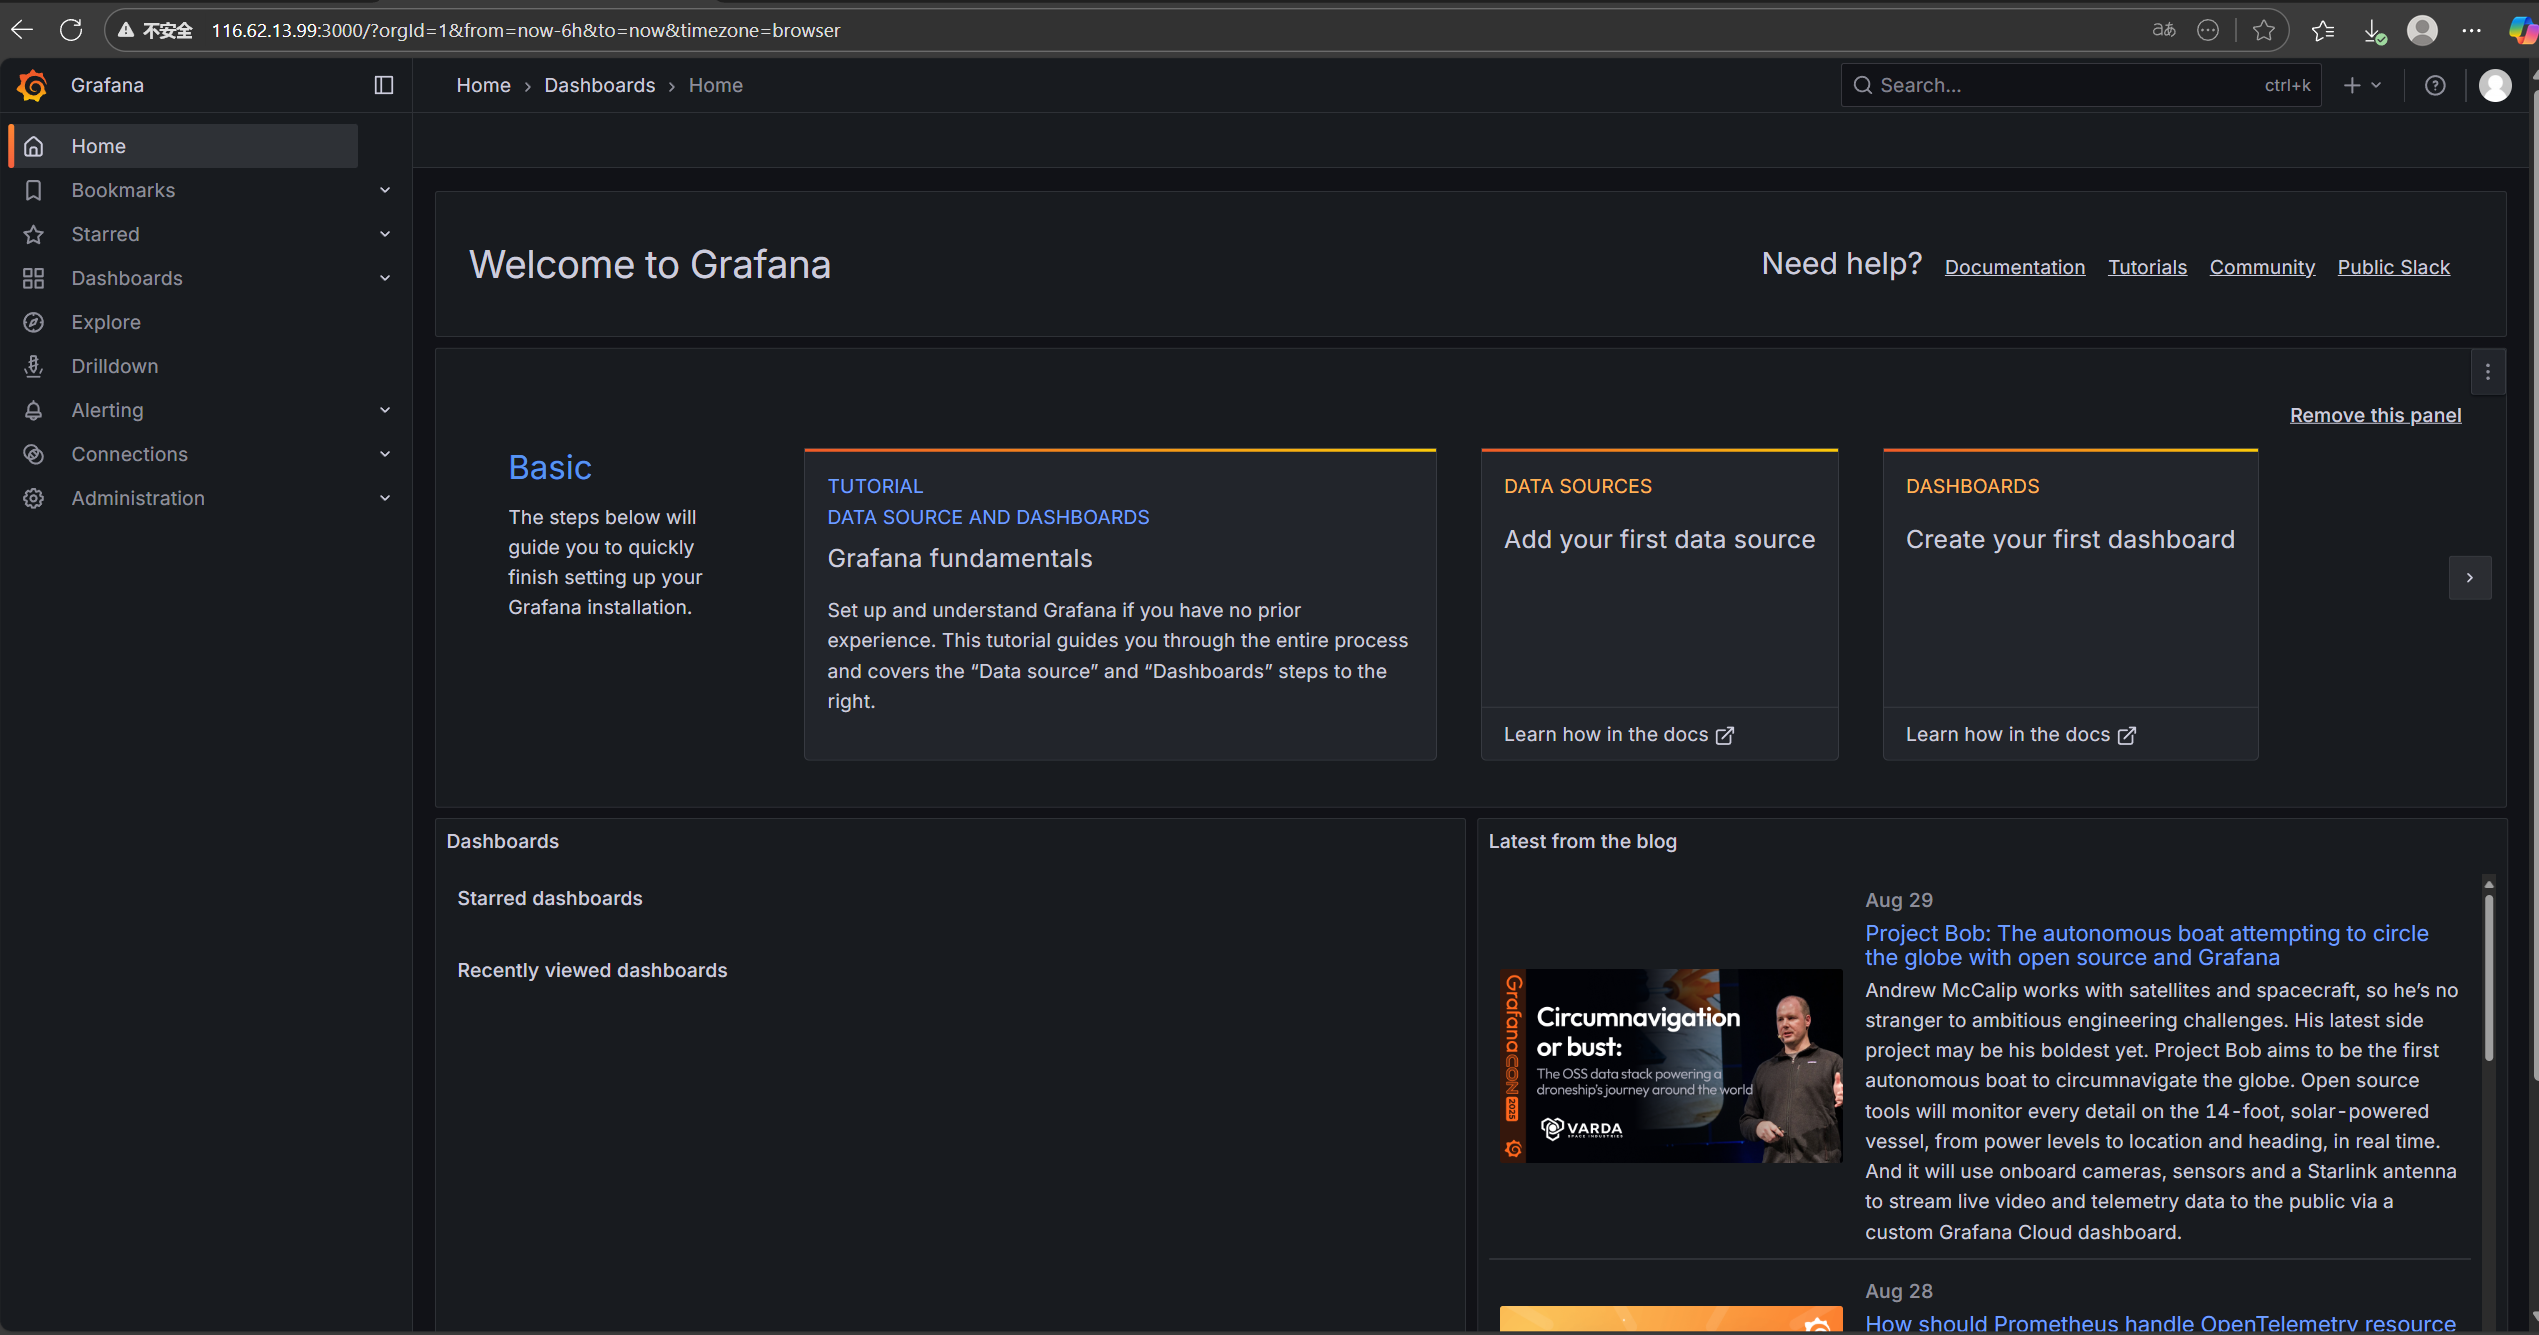
conect data source in Grafana
Visit http://
In the left-hand menu, select Connections -> Data sources -> Add data source.
Select Prometheus, enter http://localhost:9090 in the URL field, and click Save & Test.
Import the dashboard:
In Grafana, select Dashboards -> New -> Import.
Enter 1860 in the input field, click Load, and complete the import.